

Cadet Talha
Student of BSAI


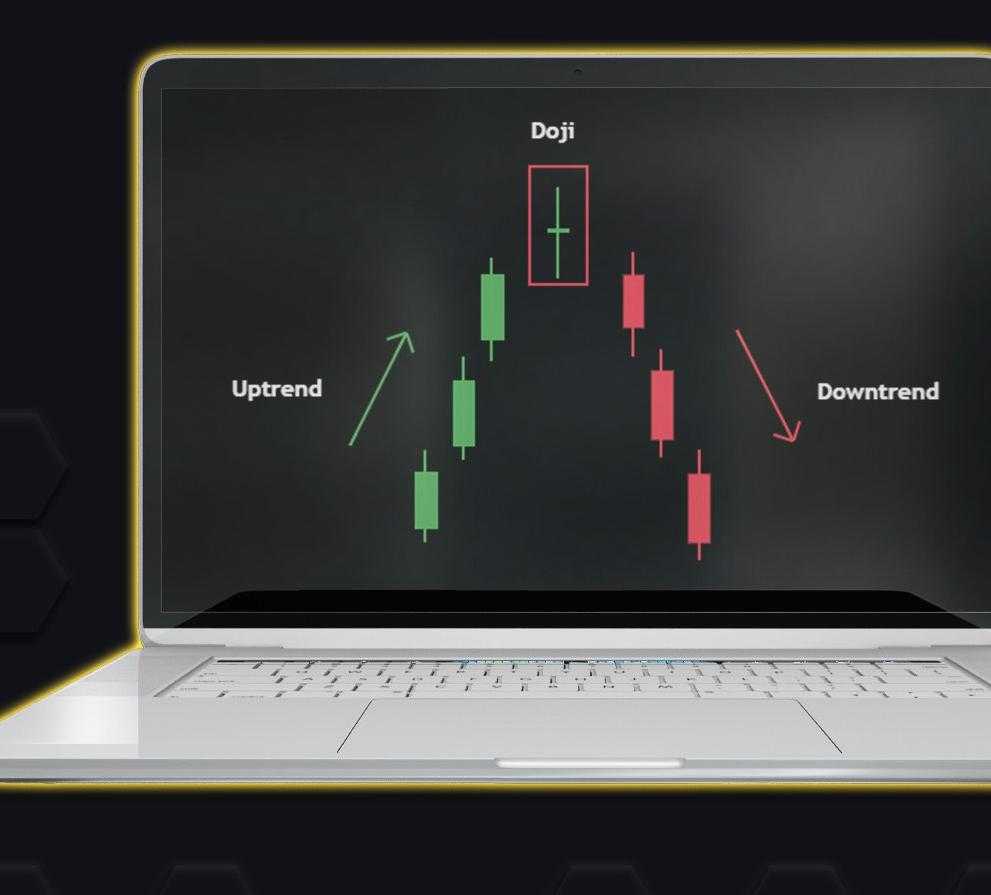
Doji candle pattern
🔅A Doji is a single candlestick pattern that is formed when the opening price and the closing price are equal.
🔅The lack of a real body conveys a sense of indecision or tug-of-war between buyers and sellers and the balance of power may be shifting.
🔅The length of the upper and lower shadows can vary and the resulting candlestick looks like a cross, inverted cross or a plus sign.
🔅By themselves, the Doji is usually considered a neutral pattern but is part of multiple-candlestick patterns.
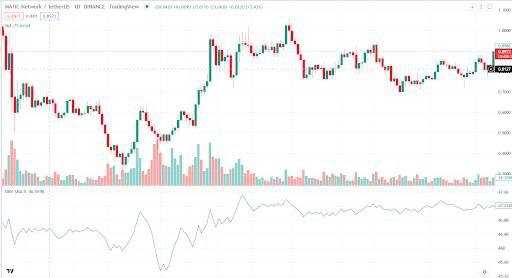
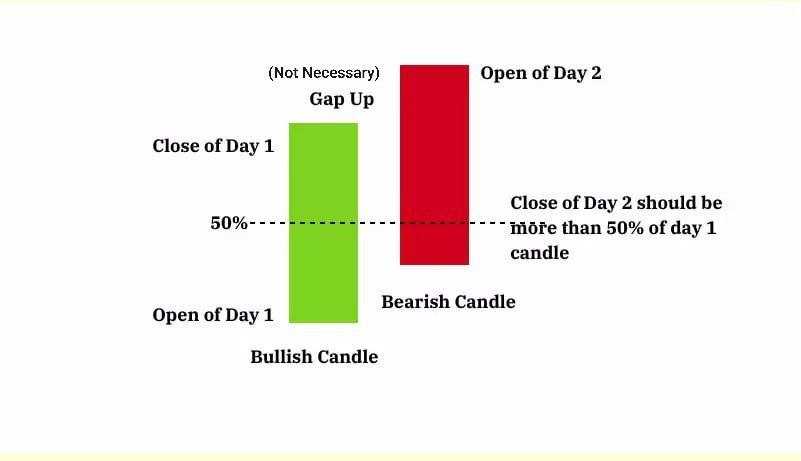
What is Dark Cloud Cover Candlestick ?
#dark Cloud Cover is a two-candlestick pattern that appears on a price chart and is often used as a bearish #reversal signal. The pattern is formed when a bullish candlestick is followed by a bearish #candlestick, which opens above the high of the previous candlestick and closes below the midpoint of the previous #candlestick's body.
The pattern suggests that the market has shifted from a bullish #sentiment to a bearish one, and that the bears have gained control. It is considered more significant when it appears after a sustained #uptrend and is confirmed by other technical indicators, such as #volume and #moving averages.
Traders often use the #dark Cloud Cover pattern as a signal to enter a #short position or to exit a #long position.

Usman Ali
Delete Thought
Are you sure that you want to delete this thought?
MK Kawsar
Delete Thought
Are you sure that you want to delete this thought?
Amjad Khan
Delete Thought
Are you sure that you want to delete this thought?